finance
How derivatives and spot markets set prices
Explains when hedging, liquidity, and leverage let derivatives positions feed back into spot prices, from the 1987 market crash to crypto derivatives.
Both traditional and decentralized markets face challenges from well-capitalized traders whose positions can affect liquidity and volatility.
The thesis of this piece, stated up front: derivatives derive value from an underlying asset, but the hedging and settlement of large positions can feed back into the underlying market.
That feedback is not automatic. It depends on position size, dealer exposure, liquidity, time to expiration, and how market makers hedge. A visible cluster of calls or puts can coincide with a market move without causing it. The useful question is therefore not whether options control spot prices, but when the hedging flow is large enough to matter alongside other buyers and sellers.
Market structure
Market structure encompasses the characteristics of a market, such as the number and size of buyers and sellers, competition level, information availability, regulatory environment, and the physical and virtual infrastructures where financial instruments are traded.
These can all affect market efficiency, price discovery, and overall price trajectory.
During the pandemic-era retail trading boom, "gamma squeeze" became a common label for one possible feedback loop. If dealers are net short calls, they may buy more of the underlying as its price rises and the calls' delta changes. That hedge can add demand to an already rising market. Dealers can also be positioned differently, and option volume alone does not reveal their net exposure. The SEC's review of GameStop trading in early 2021 found no evidence that a gamma squeeze explained the episode, a useful warning against treating the label as a complete diagnosis.
Consequences of 1987
How can these dealers be so involved when they impact the market so much? The answer is liquidity.
Exchange-designated market makers (NYSE specialists, today's DMMs) carry affirmative obligations to maintain fair and orderly quotes, obligations that predate 1987. What 1987 changed was the machinery around them: circuit breakers, mandatory small-order execution on Nasdaq, and tighter cross-market coordination all followed the crash, which resulted from an overcrowded trade in portfolio insurance.
The 1987 crash exposed weaknesses in market structure, including the interaction between portfolio-insurance strategies, futures, and cash equities. Regulators responded with circuit breakers and stronger coordination across markets. That history does not mean market makers now drive global markets. It shows that liquidity obligations and trading controls have limits during sharp moves.
2008 and 2020 showed the limits of that structure. Obligated liquidity is thin next to a genuine systemic panic; dealer obligations were never designed to absorb a solvency crisis or a pandemic shutdown at size, and they didn't.
In both cases, price conditions were dire enough that there seemed to be few willing buyers until central banks announced emergency liquidity and asset-purchase programs.
Notional value versus market value
One tempting comparison divides the S&P 500 index level by the Federal Reserve's total assets. The two checkpoints used in the original essay put that ratio around 0.0016 in 2007 or 2008 and around 0.0004 to 0.0006 after quantitative easing.
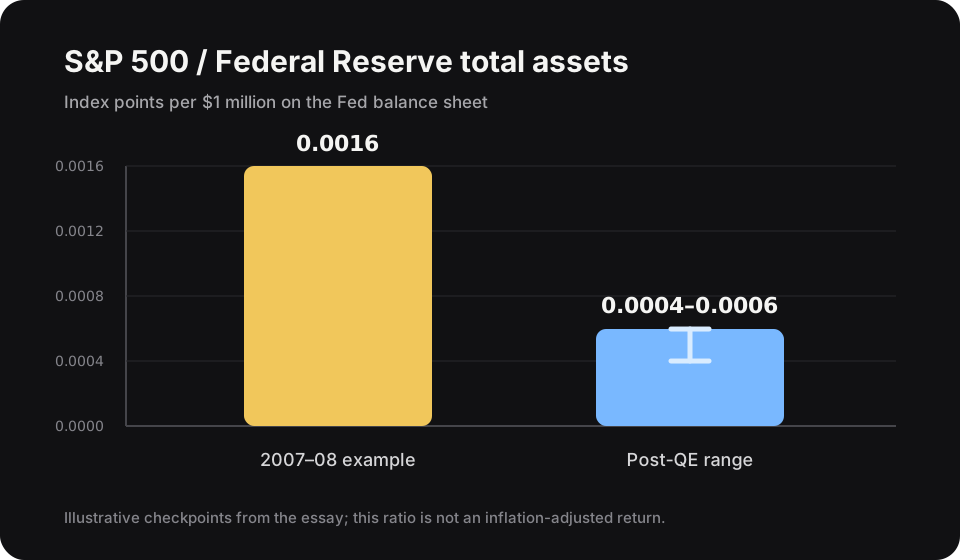
The ratio is dimensionally awkward because it mixes an index level with a dollar balance sheet. It shows only that the Fed's balance sheet expanded faster than the index across those checkpoints. It is not an inflation-adjusted return or evidence that balance-sheet growth caused equity prices to rise.
Asset scarcity
Scarcity, physical or digital, has made its way to the front lines of the debate on asset valuation. The Bank for International Settlements reported $632 trillion in outstanding OTC derivatives notional at the end of June 2022, compared with $18.3 trillion in gross market value. Notional amount is a contract reference value, not money at risk and not directly comparable with stock-market capitalization. These contracts serve many purposes, including hedging, financing, price discovery, and speculation.
The relevant quantity is not gross notional alone. Feedback depends on net exposure, collateral, maturity, liquidity, and the trades needed to hedge or settle the contracts.
Reflexivity
Reflexivity describes a feedback loop in which participants' beliefs affect prices, and prices then affect those beliefs and the underlying economy. It is sometimes compared with the observer effect in physics, but markets are social systems composed of participants who act on what they observe.
Derivatives add another feedback channel because hedging one market can require trading in another. The analogy is useful, but it is not a physical law or a claim that observation alone moves prices.
Crypto derivatives
Large participants in both markets include market makers, funds, institutions, and individuals. Crypto markets add a large cohort of early holders and trade around the clock across venues with different rules and liquidity. Those conditions can increase volatility, but participant type alone does not explain the difference.
Crypto derivatives are niche compared to equity derivatives, and their notional value is far lower. The existence of multiple crypto futures exchanges, funding rates, on-chain activity and other factors further muddy the water.
For example, Bitcoin prices and funding rates can diverge across exchanges. S&P 500 E-mini futures are concentrated at CME and connect to a deep arbitrage network, so large venue-to-venue gaps are less common.
Bitcoin's premium has been as high as 20% in South Korea due to restrictions on foreigners trading the South Korean won. Such a premium can narrow through permitted arbitrage or as local demand changes, but capital controls can make it persistent. Equity markets are not premium-free; dual-listed shares, ADRs, and China's A/H share classes trade at persistent spreads, but the concentrated structure of index futures tends to keep gaps smaller. Crypto's fragmented structure can make the same phenomenon larger and more frequent.
Market structure shapes volatility
Market structure, large participants, liquidity, and reflexive behavior can contribute to price movements and volatility. Positioning data is one input, not a standalone trading signal, and claims about causation need evidence beyond a price landing near an options strike.