finance
Comparing Bitcoin with gold
Compares Bitcoin and gold by scarcity, portability, divisibility, and verifiability, and asks how much of each asset's demand is mimetic.
Bitcoin issuance per block
FigureBitcoin was initially intended to be a peer-to-peer medium of exchange1, although its narrative has shifted toward that of a global store of value.
As of early 2025, few of Bitcoin's prominent institutional advocates still pitch it primarily as a transactional currency. A highly volatile asset is poorly suited for everyday payments, though Lightning proponents and the communities using BTC for payments and remittances are real exceptions to that generalization.
Two arguments run through this piece. The first compares scarcity, portability, divisibility, and verifiability. The second asks how much of each asset's demand is mimetic, meaning people value it partly because other people do. That second claim is a lens for comparison, not a complete theory of either market.
(A note on the charts: figures labeled through 2025 were re-rendered after the original January 6, 2025 publication.)
Inflation
Inflation is the rate at which the general price level of goods and services rises. Statistical agencies estimate inflation with price indexes. Central banks set monetary policy in pursuit of statutory goals that commonly include price stability. Unexpected inflation can reduce the real value of fixed-rate debt, but it also raises borrowing costs and does not benefit every debtor or asset owner equally.
US consumer prices rose by roughly thirtyfold between 1913 and 2024, so one dollar bought about 97% less at the end of that interval. That cumulative figure spans more than a century and does not describe a typical annual inflation rate2. The US Treasury offers nominal bonds and Treasury Inflation-Protected Securities. Nominal yields vary with maturity and market conditions; TIPS principal adjusts with CPI3.
Banks capitalize on the spread between rates paid to depositors on savings accounts and rates received from government bonds and lending activities4. The gap between a savings-account rate and a Treasury yield is not a bank's profit margin by itself. Funding costs, credit losses, operations, capital, and the mix and duration of assets also matter.
Stores of value
Money serves three purposes: unit of account, store of value, and medium of exchange5. An asset can perform these functions by degree rather than pass a binary test. A currency becomes less useful as a unit of account, store of value, and medium of exchange when it loses value rapidly. The German population experienced this problem during the 1923 hyperinflation, documented in When Money Died.
Some people use Bitcoin, USDT, or other crypto assets to seek exposure outside a depreciating local currency. The scale and purpose of that use vary by country. On-chain transfers are usually pseudonymous, not anonymous, and expose users to price, issuer, custody, protocol, and operational risk. USD remains the dominant global reserve currency. Many currencies and commodities are quoted against it, but other currencies are not mechanically dependent on it. If more local currency is required to buy one dollar, the local currency has depreciated, not appreciated.
The Turkish Lira has lost most of its value since 2018:
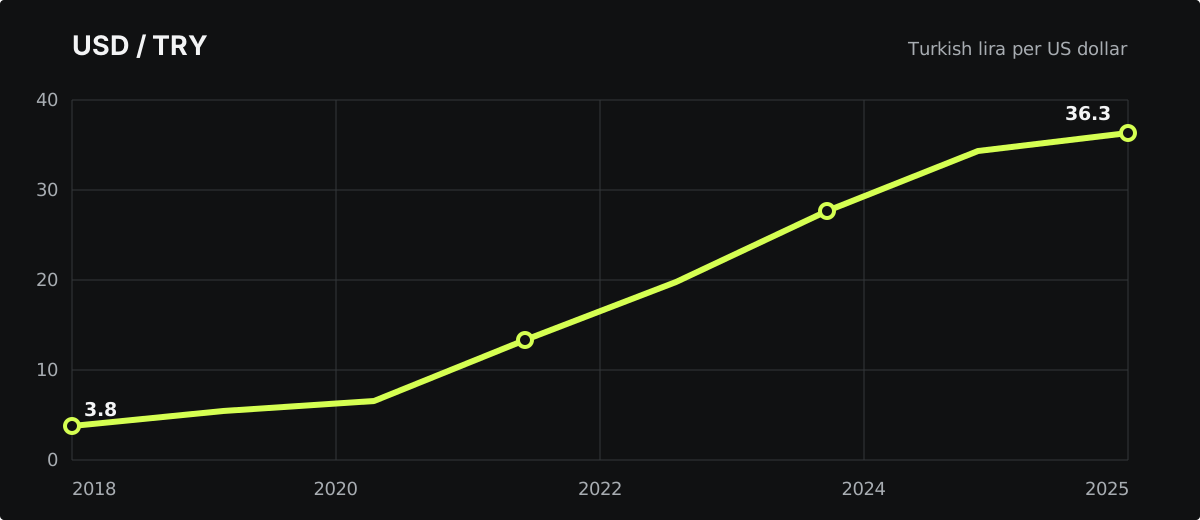
Figure 1: Turkish Lira Devaluation vs USD, 2018-2025. The TRY/USD exchange rate demonstrates severe currency devaluation, with the lira losing over 80% of its value against the dollar during this period. The chart does not isolate the causes.
The South African Rand has experienced extreme volatility over the past decade:
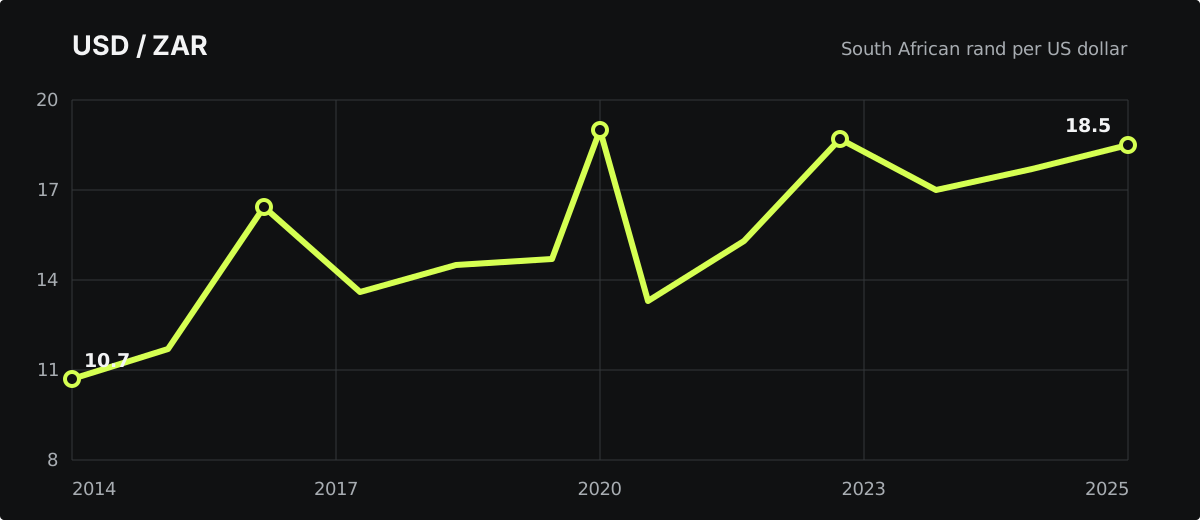
Figure 2: South African Rand vs USD, 2014-2025. The ZAR/USD exchange rate exhibits volatility and a general depreciation trend over the selected interval.
Someone who held Bitcoin for the full period from 2010 through the start of 2025 outperformed cash in nominal dollar terms. That endpoint comparison excludes Bitcoin's repeated large drawdowns and does not describe every purchase date. The famous "Bitcoin Pizza" transaction saw 10,000 BTC exchanged for two pizzas valued at approximately $25-30 on May 22, 2010, representing a price of roughly $0.0025-0.003 per BTC6. Bitcoin set an all-time high above $108,000 in mid-December 2024, weeks before this essay's publication7.
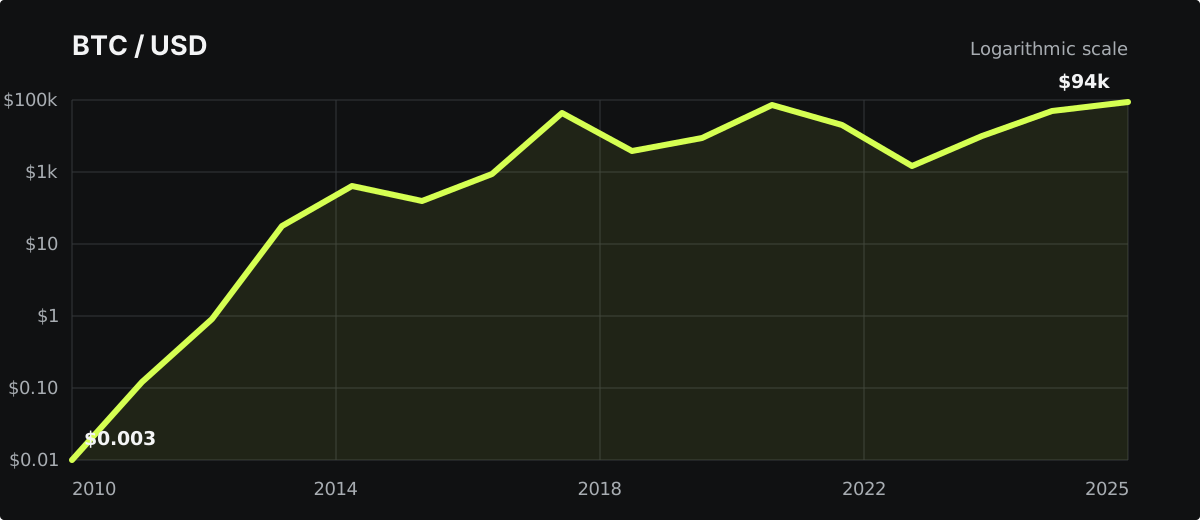
Figure 3: Bitcoin Price in USD, 2010-2025. The selected endpoints show appreciation from less than $0.01 to more than $100,000, alongside repeated large drawdowns.
An inverted BTC/USD chart expresses the same historical price series from the other direction:
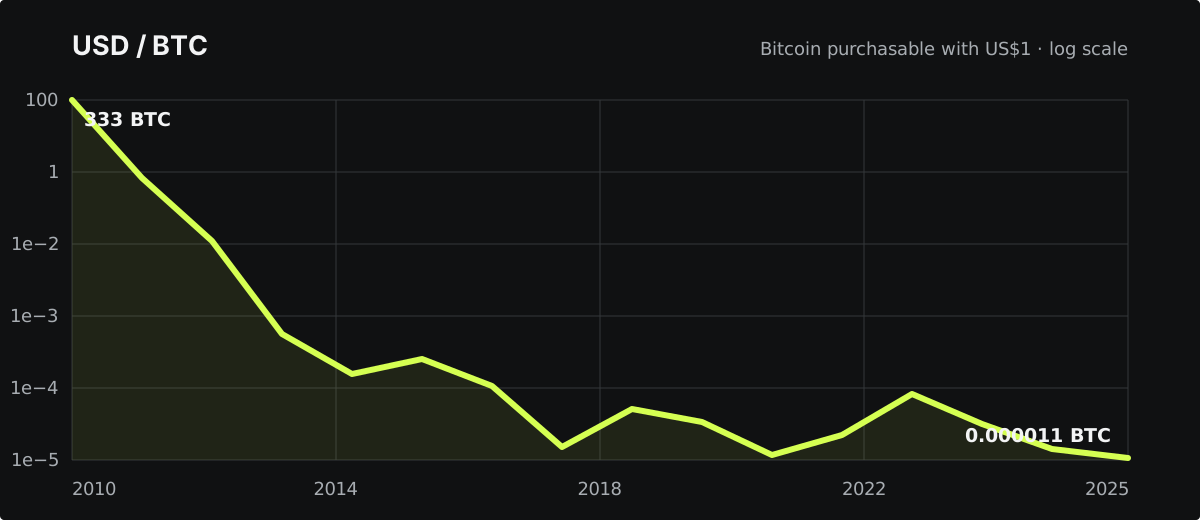
Figure 4: USD value measured in Bitcoin, 2010-2025. This is not a general purchasing-power index. It shows how many bitcoin one dollar bought at each point in the selected period.
Gold
Gold has sometimes performed well during economic or geopolitical stress, but its returns vary by crisis, currency, interest rates, and starting valuation. It is commonly treated as a destination for flight-to-quality flows within the portfolio allocation frameworks of institutional investors.
Capital flows into perceived safe-haven assets depend on liquidity needs, interest rates, currency moves, portfolio rules, and investor beliefs. Mimetic demand can reinforce those flows, but it is not their sole cause.
Beyond its use in jewelry and select manufacturing applications (electronics, aerospace), gold is perceived to exist outside traditional financial systems. However, central banks hold substantial official gold reserves8. Gold derivatives markets are substantial, and price manipulation cases have resulted in significant regulatory enforcement actions9.
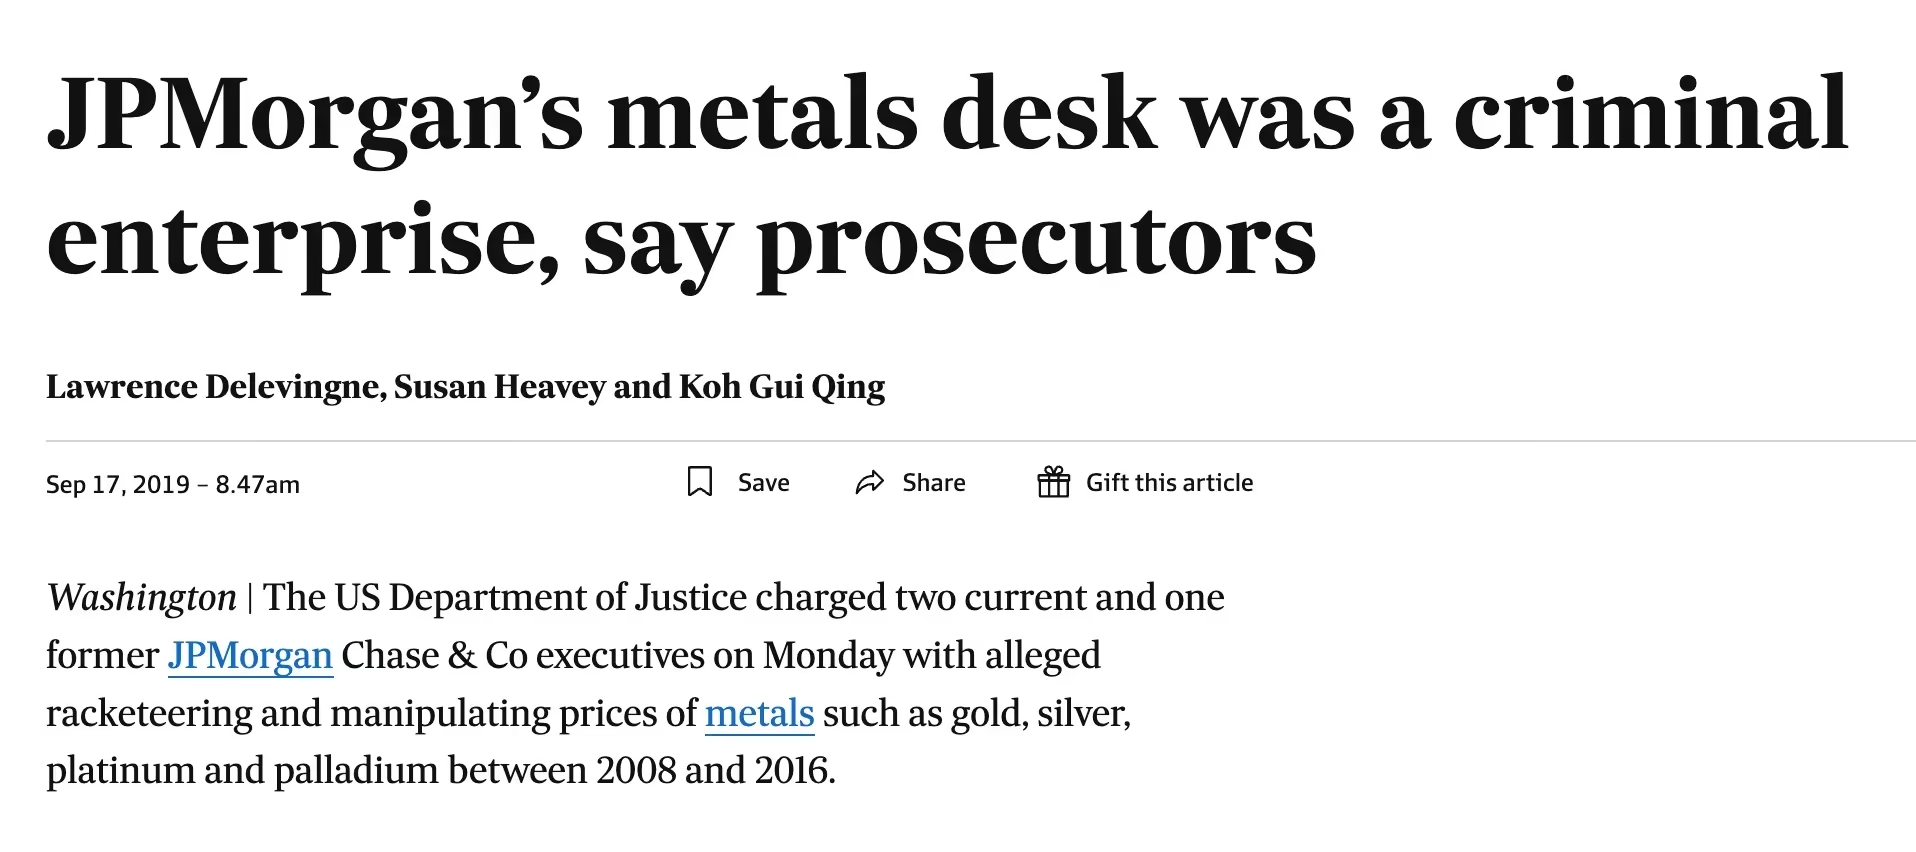
Figure 5: JPMorgan Gold Market Manipulation. JPMorgan Chase entered a 2020 resolution involving spoofing in precious-metals and US Treasury markets. The case documents misconduct by traders; it does not show that institutions determine gold's long-run price.
Digital gold
Investors and media analysts have referred to Bitcoin as "digital gold" because the two assets share some monetary properties despite different market histories and failure modes.
| Feature | Physical Gold | Bitcoin |
|---|---|---|
| Portability | Physical transfer can be costly | Keys can authorize global transfer, subject to network and legal constraints |
| Divisibility | Physical division requires processing | Divisible to eight decimal places on the base layer |
| Verifiability | Requires testing or a trusted custodian | On-chain history is publicly verifiable; ownership claims and software still require care |
| Transfer | Physical transfer can be slow and expensive | Global settlement, with time and cost varying by network conditions and method |
| Storage | Vaults and physical security | Keys, backups, and operational security |
| Scarcity | Supply responds slowly to geology, price, and mining | Current consensus rules cap issuance at 21 million BTC |
Extrinsic value and mimetic desire
While gold has performed well during some periods of economic distress, its valuation cannot be reduced to intrinsic cash flow. Gold is difficult to transport or store at scale. The precious metals industry is highly concentrated among a relatively small number of institutional players. Gold's price reflects investment and central-bank demand, jewelry and industrial use, mine supply, recycling, real interest rates, currencies, and collective belief. Mimetic demand is one part of that system, not the whole explanation.
Mimetic desire, as theorized by René Girard, suggests people desire objects because others desire them. In asset markets, this manifests as investors purchasing gold not for its industrial utility but because other investors and institutions value it, creating self-reinforcing price dynamics.
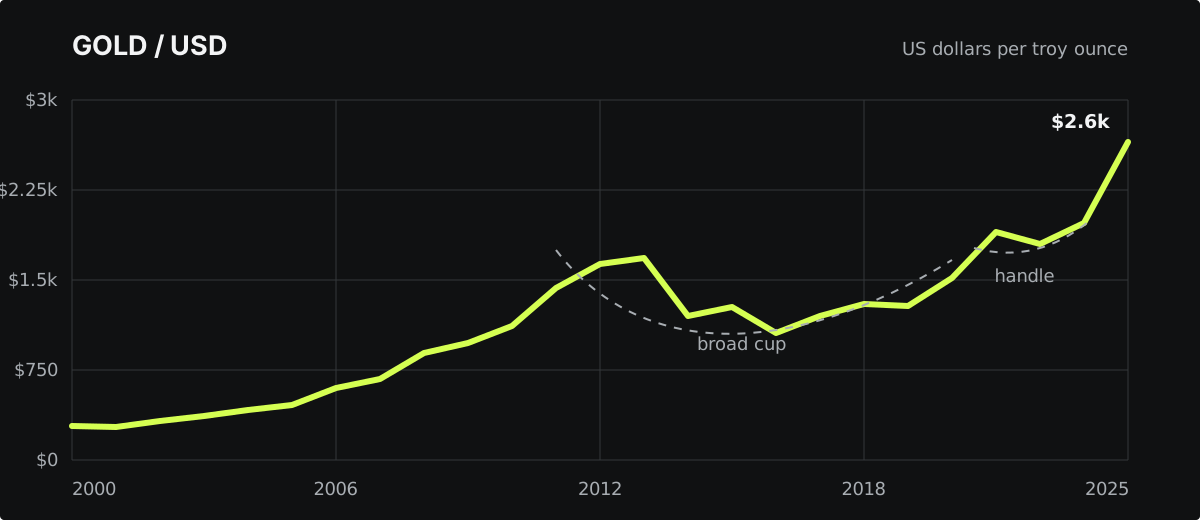
Figure 6: Gold Price Chart, Long-term. The chart was labeled as a possible cup and handle pattern in the original analysis. Pattern labels are subjective and do not predict a continuation on their own.
Counterarguments to Bitcoin's scarcity
Bitcoin's volatility makes it difficult to use as a primary unit of account or short-term store of purchasing power. The US dollar remains dominant in global reserves and ordinary pricing. Institutional Bitcoin holdings may broaden access while also concentrating voting-free economic ownership and custody in a smaller set of companies and service providers.
Instead of serving as a payment mechanism, Bitcoin could function as a store of value if users continue to value its properties and the network remains reliable. Scarcity is a key component of both gold and Bitcoin's value proposition.
Gold's scarcity depends on geology, extraction economics, mine investment, and recycling. Bitcoin's scarcity depends on consensus rules implemented and enforced across independent software and network participants10:
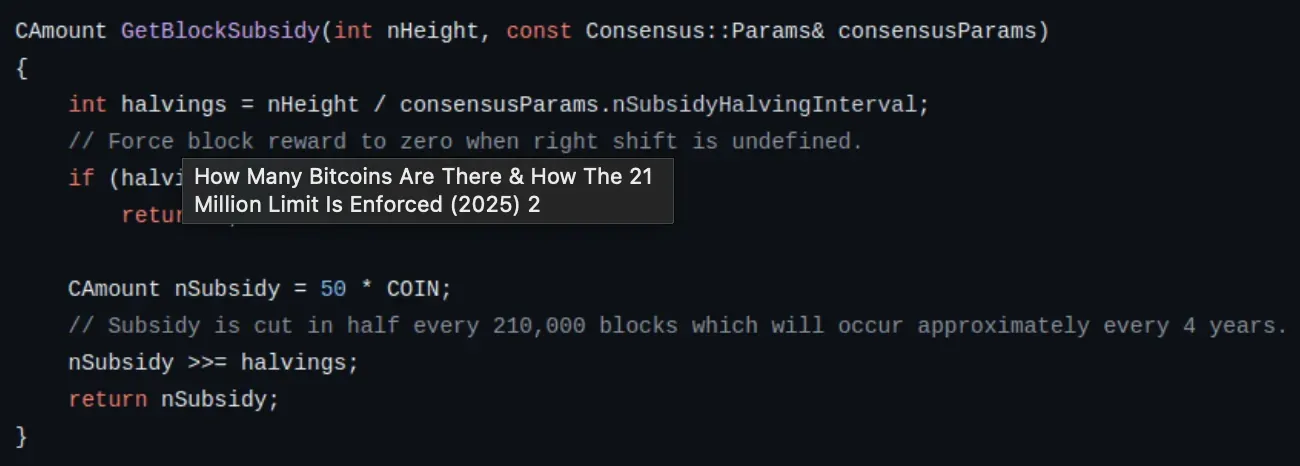
Figure 7: Bitcoin Supply Cap Code. The Bitcoin protocol's supply cap is enforced through consensus rules in the software. This code limits total supply to 21 million BTC, with the final bitcoin scheduled for mining around 214011.
Contributors maintain Bitcoin Core, the most widely used implementation. They can propose and publish software, but cannot force node operators, miners, exchanges, or users to adopt a rule change.
If maintainers released software with a different supply cap, each participant could reject it by continuing to enforce the existing rules. A conflicting rule set could split into a separate network rather than alter the bitcoin recognized by holdouts. Bitcoin's verification process, proof-of-work mining, is an expensive undertaking. High capital and energy costs have resulted in a small number of mining pools controlling the majority of network hash power12.
While the 21 million cap theoretically could be changed, adoption would require broad agreement among economically relevant participants and could split the network. The cap is therefore a social and technical commitment, not a law of nature13.
However, Bitcoin faces several risks that potential investors should consider:
Regulatory risk: Government crackdowns, restrictions on exchanges, or outright bans could significantly impair accessibility and value.
Technological vulnerabilities: While the Bitcoin protocol had operated for sixteen years at publication, quantum computing advances or undiscovered cryptographic vulnerabilities pose theoretical long-term risks.
Extreme price volatility: Bitcoin has experienced multiple drawdowns near or above 80%, making it unsuitable for risk-averse investors or short time horizons.
Physical security threats: The $5 wrench attack represents a fundamental security concern where physical coercion bypasses cryptographic protections. High-profile attacks on cryptocurrency holders highlight real-world security challenges facing the industry.
Bitcoin and gold remain different assets
Gold allocations vary by investor, mandate, and source; there is no universal recommended percentage.
Bitcoin offers easier division and remote transfer than physical gold. Its verifiability still depends on software, custody, and the distinction between an on-chain balance and an intermediary's ownership claim.
However, Bitcoin's volatility, regulatory uncertainty, and relative youth as an asset class distinguish it from millennia-old gold. Gold has millennia of cultural and institutional use as a store of value. Bitcoin had 16 years of history at publication.
Whether Bitcoin becomes "digital gold" depends on sustained network security, continued decentralization, market liquidity, legal access, and sustained demand. The comparison supports a narrower conclusion: both assets depend partly on shared belief, while their supply, custody, market history, and failure modes differ. It does not establish an appropriate portfolio allocation.
Footnotes
-
Nakamoto, Satoshi. "Bitcoin: A Peer-to-Peer Electronic Cash System" (2008). ↩︎
-
Bureau of Labor Statistics CPI data, 1913-2024. ↩︎
-
Federal Reserve data on bank net interest margin. ↩︎
-
For detailed analysis of money's functions, see Federal Reserve Education: Functions of Money. ↩︎
-
In a May 2010 BitcoinTalk post, Laszlo Hanyecz offered 10,000 BTC for two pizzas and later confirmed the trade. ↩︎
-
Bitcoin price data from major exchanges (Coinbase, Binance, Kraken). The mid-December 2024 all-time high printed above $108,000; exact figures vary slightly by exchange. ↩︎
-
World Gold Council data on official gold reserves. ↩︎
-
The US Department of Justice announced JPMorgan Chase's $920 million resolution involving spoofing in precious-metals and US Treasury markets in 2020. ↩︎
-
The Bitcoin supply cap is implemented through block subsidy rules in the Bitcoin Core codebase. ↩︎
-
Bitcoin's mining reward halves approximately every 4 years (every 210,000 blocks). ↩︎
-
Mining pool concentration data from Blockchain.com Pool Distribution. ↩︎
-
Changing Bitcoin's 21 million supply cap would require a contentious hard fork and would likely split the network. ↩︎